






I take data the whole way: ingestion, Azure pipelines, SQL star schemas, Power BI reports and ML models. Every report I build opens with one quantified headline, and the rest of the page is the evidence for it.
Before I analysed insurance and investment products I spent 2+ years in BFSI selling and servicing them. Today I freelance as a Data Analyst with Finonus Capital. B.Com graduate, certified by Microsoft (PL-300, AZ-900, DP-900) and AWS.
Domains: Retail & FMCG, Finance & Insurance, Healthcare, E-Commerce · Open to: Data Analyst, BI Developer, Power BI Developer
Each project starts from a business question and ends on one number. Open any of them for the method and the report pages.

Grocery Retail Analytics · latest build · live app
dbt DuckDB SQL Python statsmodels Power BI DAX Streamlit GitHub Actions
Method, findings and report pages
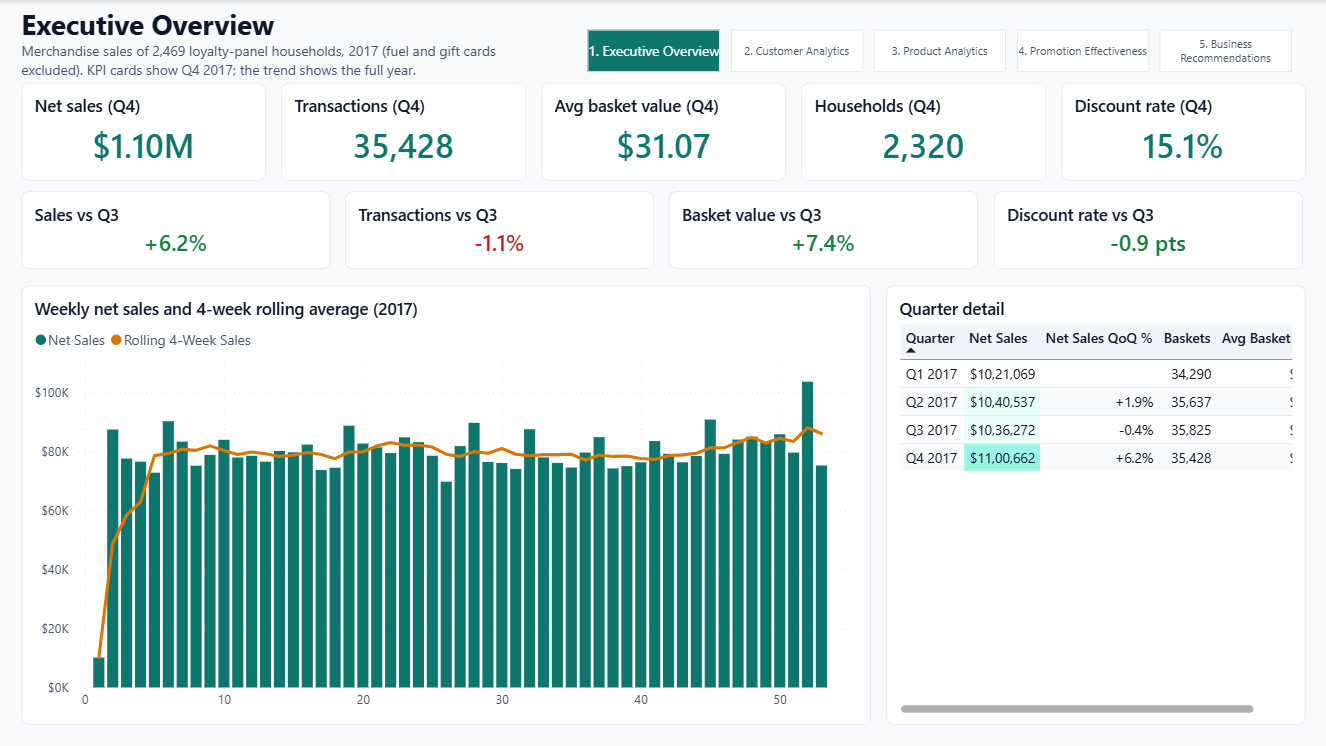
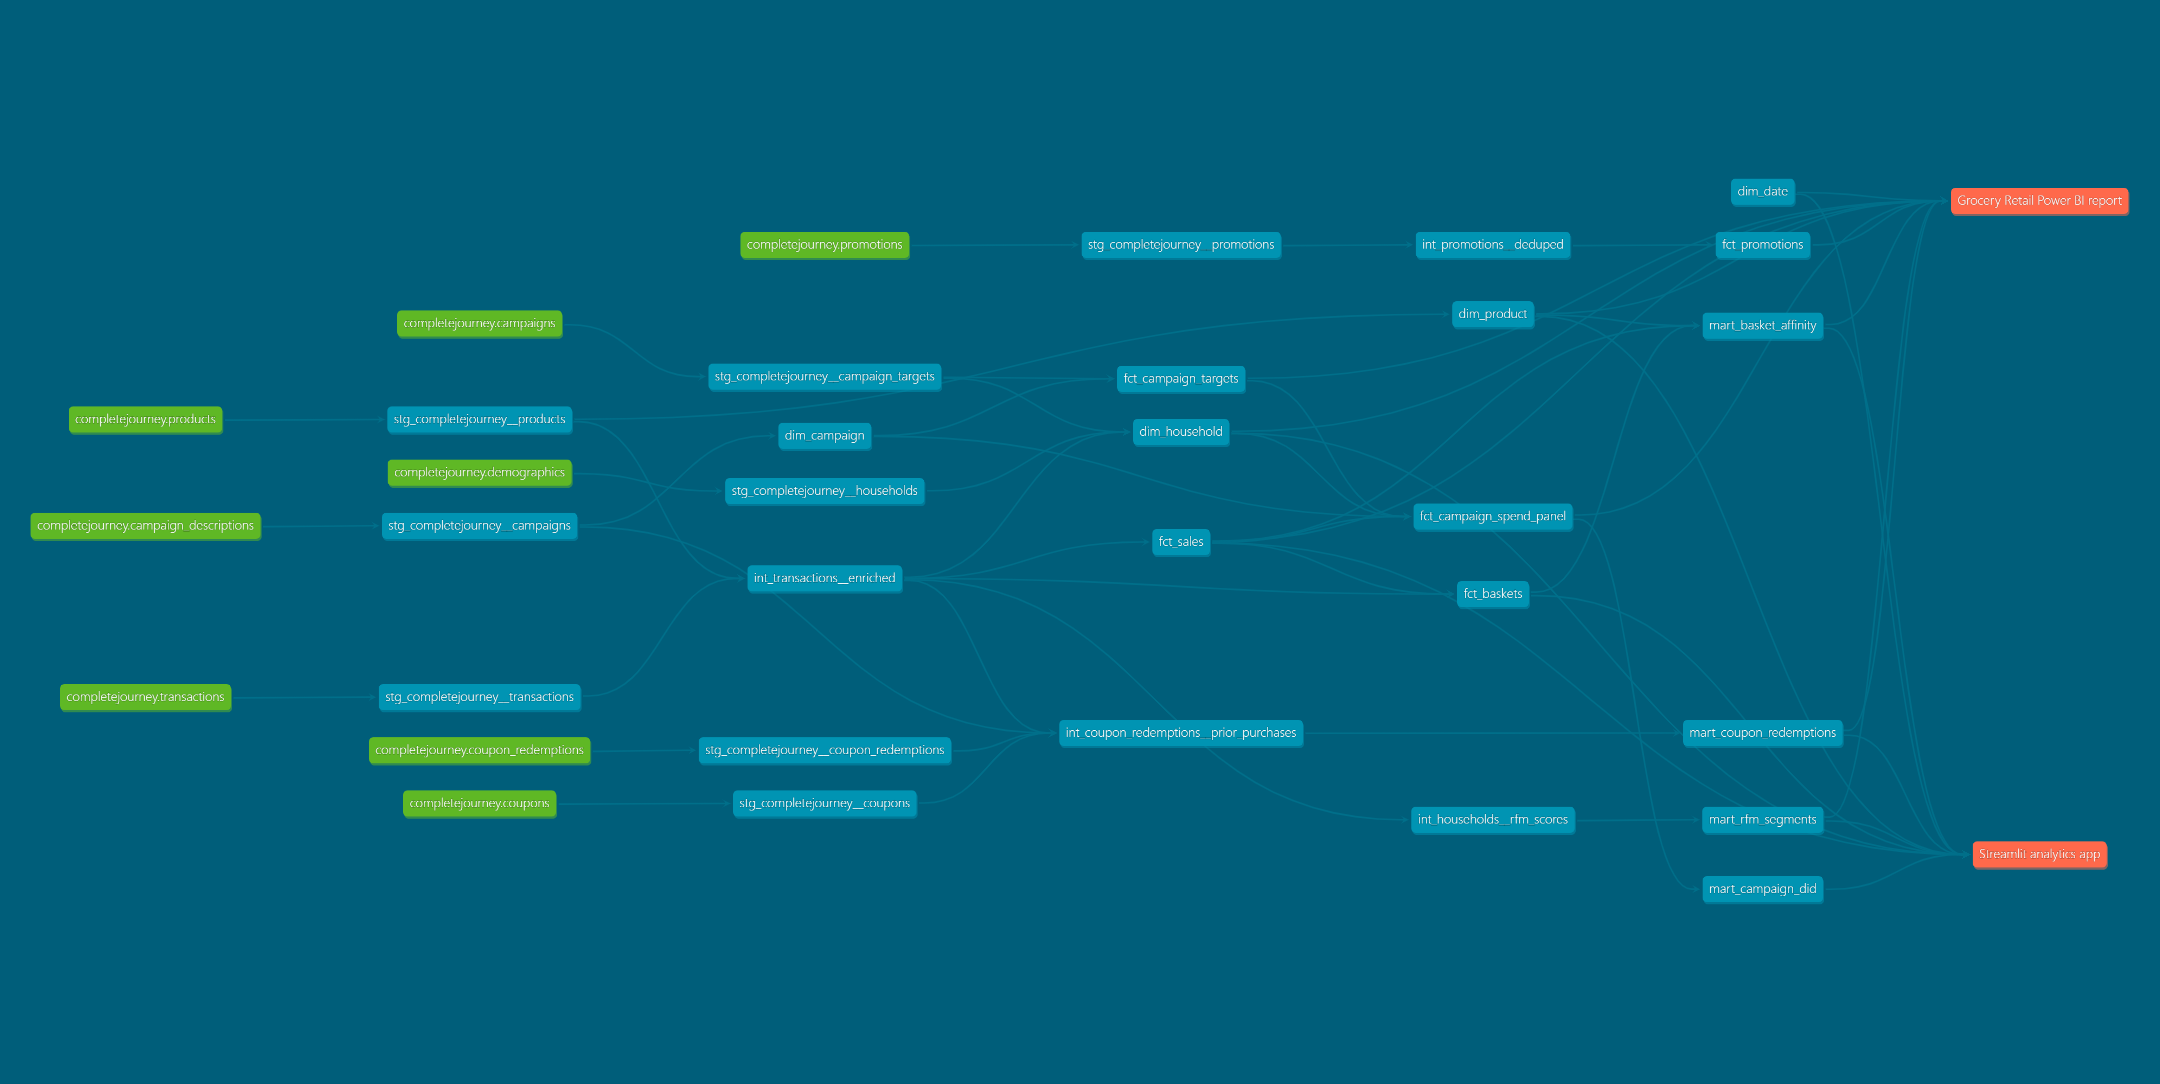
1.46M real transactions from 2,469 households. A dbt project on DuckDB with 28 models (staging, intermediate, marts), 102 data tests and 6 unit tests, incremental fact tables and CI on every push. On top of it: 13 SQL analyses, difference-in-differences with placebo tests, a 5-page Power BI report (45 DAX measures) and a Streamlit app with a cite-or-refuse "ask the data" assistant.
- The top 10% of households drive 34.2% of sales, and 318 lapsing regulars still hold 13.4%
- Display plus mailer is linked to 225% higher sales, but the placebo checks failed, so the recommendation is a 10% random holdout rather than a claimed win
- Every table was checked row by row against the old pipeline during the move to dbt, and the SQL-vs-DAX reconciliation (58 of 58 checks now match) caught 3 DAX bugs

Healthcare Provider Fraud Detection
Azure Data Factory PostgreSQL Python scikit-learn Power BI DAX
Method, findings and report pages
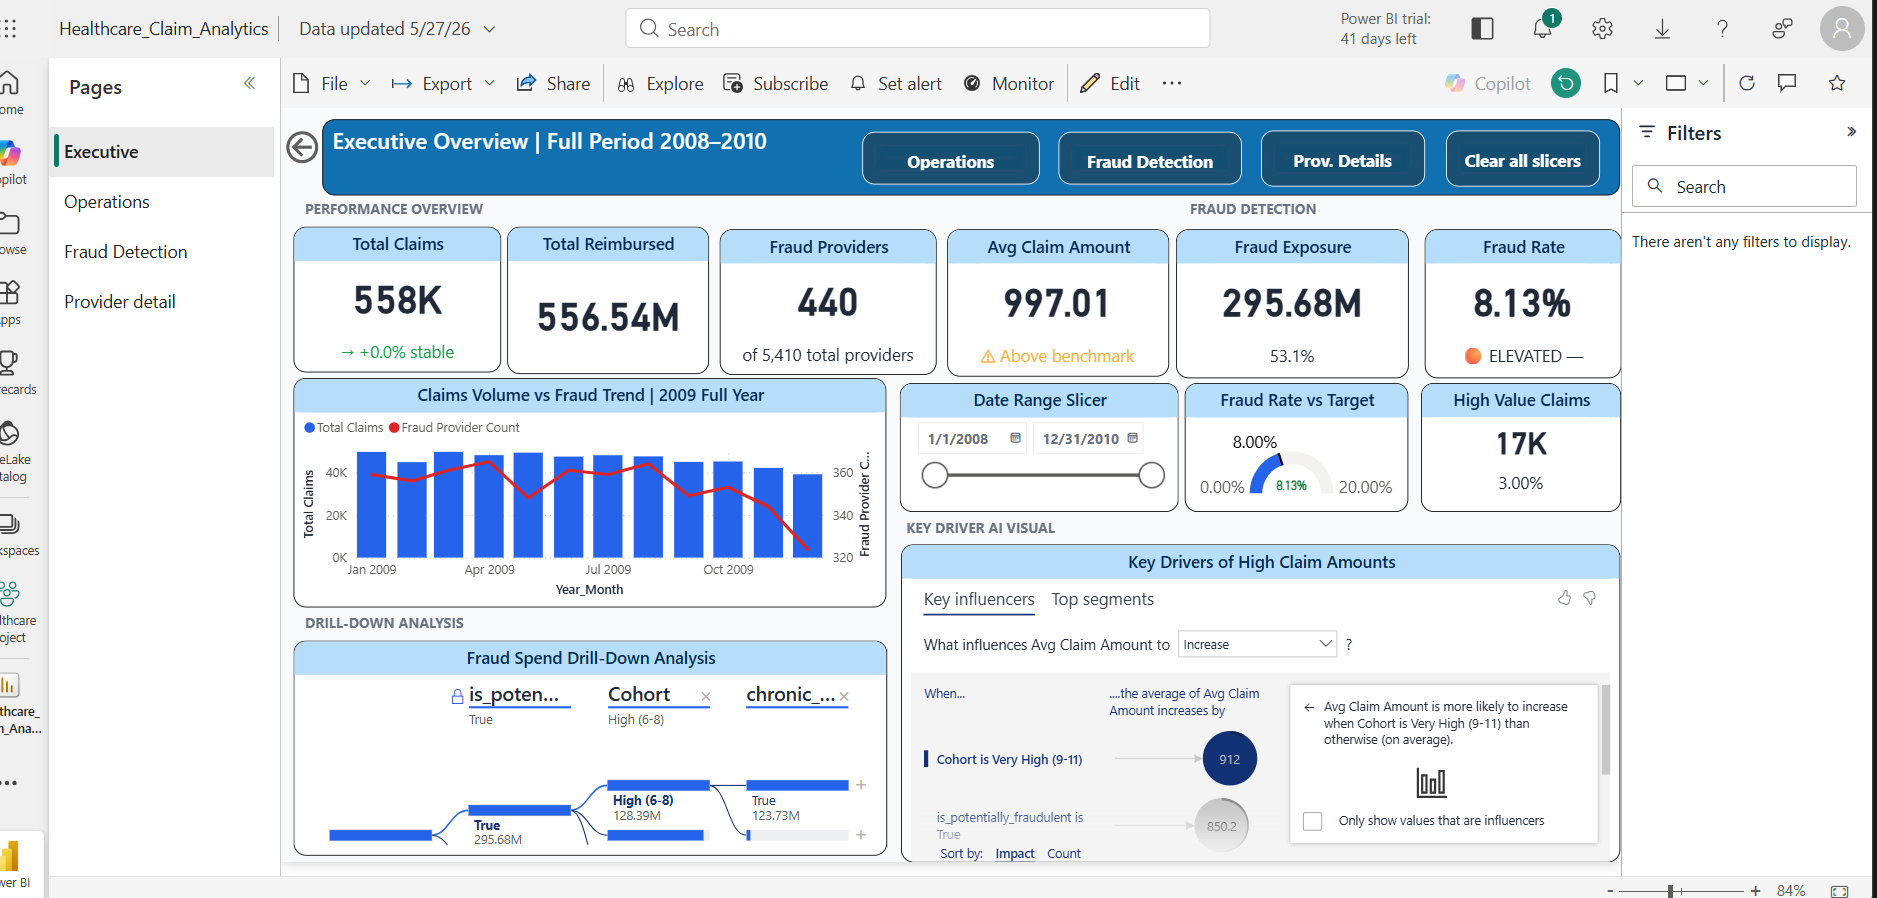
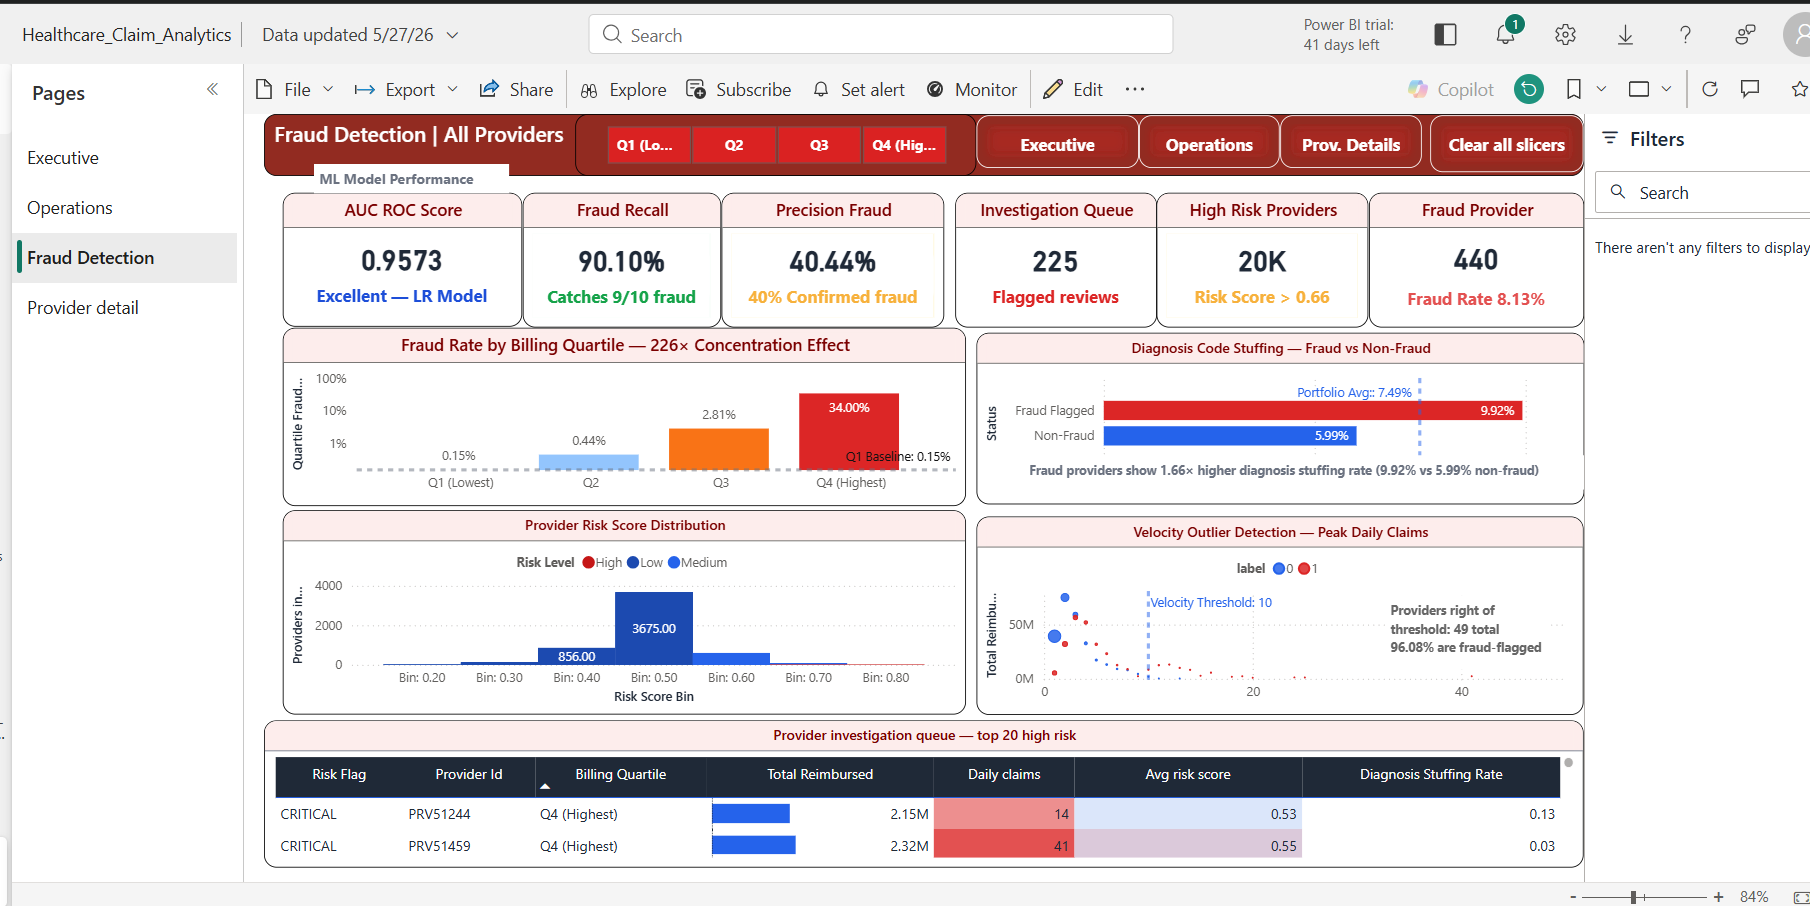
558,211 Medicare claims across 5,410 providers. Azure Blob to Data Factory to a 9-table PostgreSQL warehouse (2.43M rows), a scikit-learn fraud model (AUC 0.9573, 90.1% fraud recall) and a 4-page Power BI report with provider drill-through.
- Audit list: the top 50 providers (0.9%) cover 35.3% of flagged dollars, and all 50 are flagged
- $295.7M sits with the 506 flagged providers
- Threshold tuning lifted XGBoost recall from 65% to 93%, at the cost of a larger review queue
- 96% of high-velocity providers (more than 10 claims a day) are fraud-flagged
- Fraud providers file 9+ diagnosis codes 1.66× as often, a sign of diagnosis stuffing

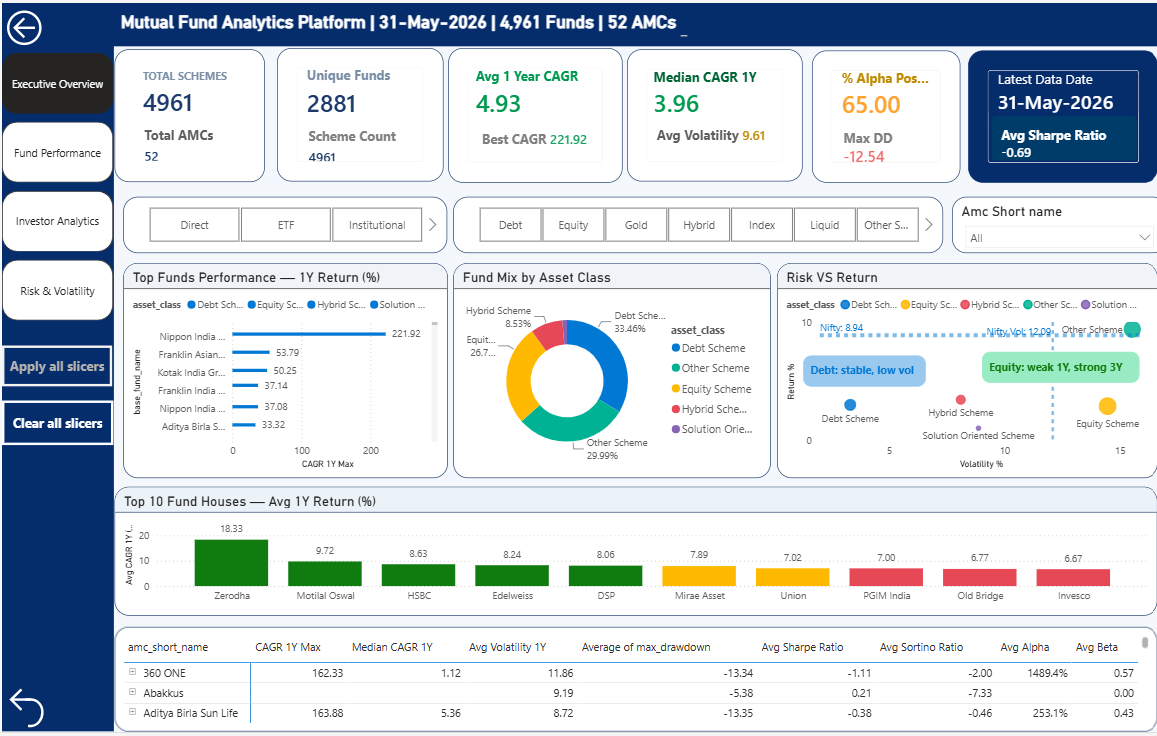
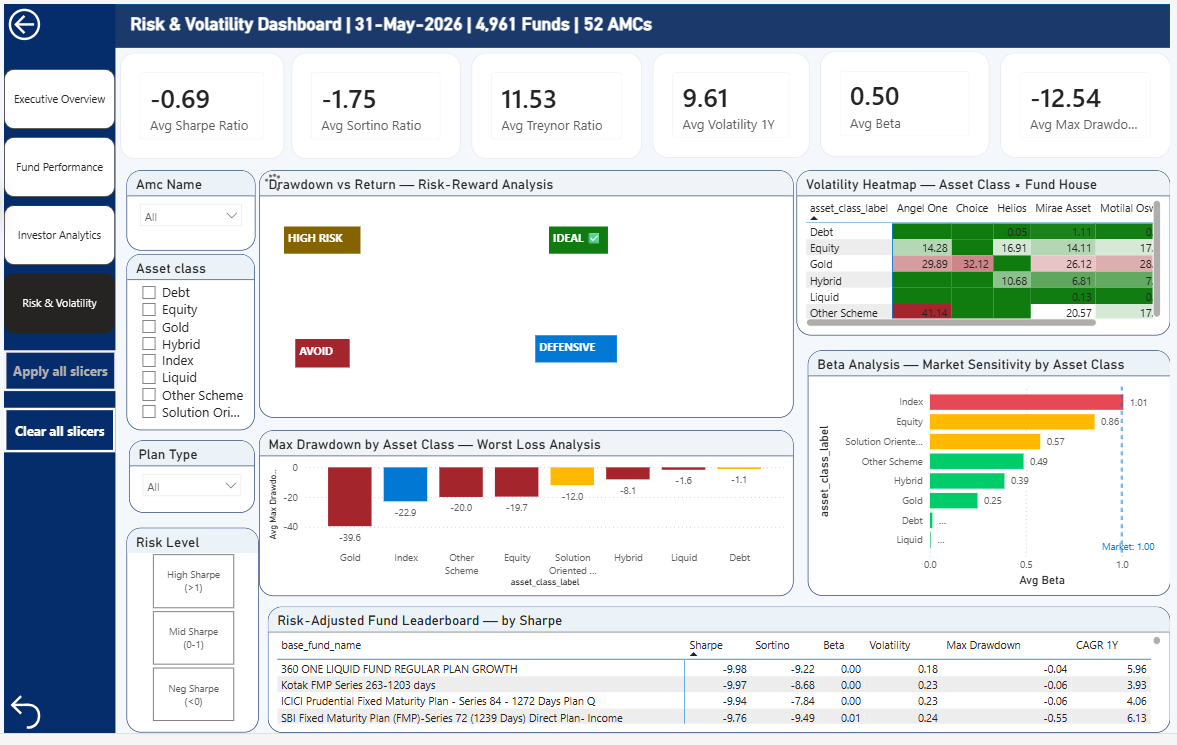
Mutual Fund Analytics Platform · live app
Azure Data Factory Azure SQL Python Prophet Power BI Streamlit
Method, findings and report pages
9.7M daily NAVs across 8,620 live schemes. Yahoo Finance and AMFI data land in Azure Blob, move through Data Factory into an Azure SQL star schema, then into a Python risk suite, a 4-page Power BI report and a live Streamlit app.
- Tested out of sample, the shortlist's return matched its peers (9.6% vs 9.5%). The edge is smaller falls, not higher returns: a shallower worst fall in 11 of 11 overlapping windows
- Trend exploration, not forecasting: Prophet lost to a no-change baseline at 30, 60 and 90 days, so it is only used to describe trends
- Every number in the project comes from one generated file, and a test fails if the README drifts from it

Olist E-Commerce Analytics
Azure Data Factory PostgreSQL SQL Power BI DAX Power Query
Method, findings and report pages
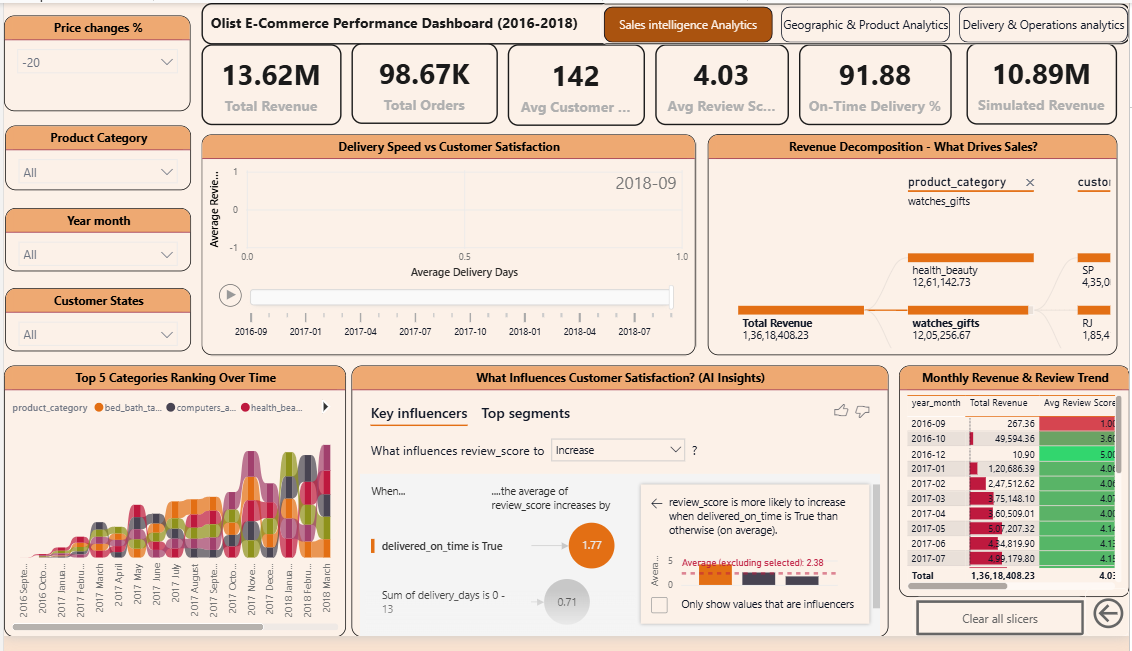
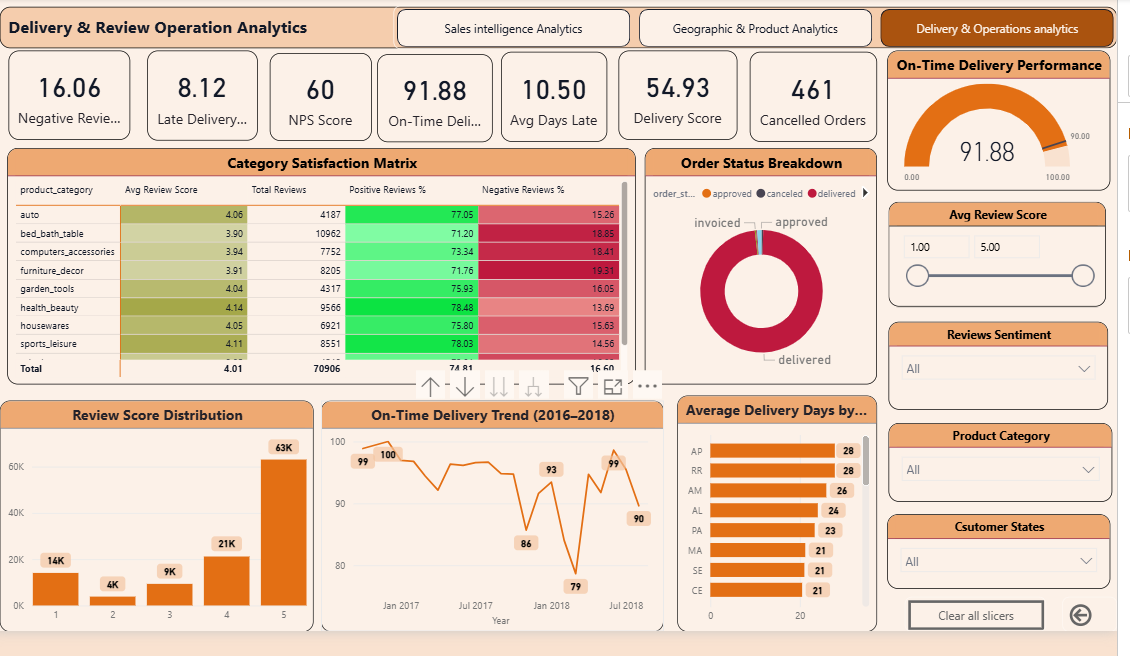
112,650 sales records. Eight raw tables land in Azure Blob, move through Data Factory into an Azure PostgreSQL star schema (4 dimensions, 1 fact), and feed a 3-page Power BI report with 40+ DAX measures, a decomposition tree, key influencers and a what-if price simulation.
- Retention is measured on
customer_unique_id, the real person. Olist issues a freshcustomer_idper order, so counting that column would show 0% repeat customers - São Paulo drives 38.3% of revenue, and health_beauty leads at R$1.4M
- On-time delivery is 91.88%, but the remote state of AP waits 28 days against a 21-day average

Customer Segmentation Engine · live app
Python Pandas scikit-learn PCA Streamlit
Method, findings and charts
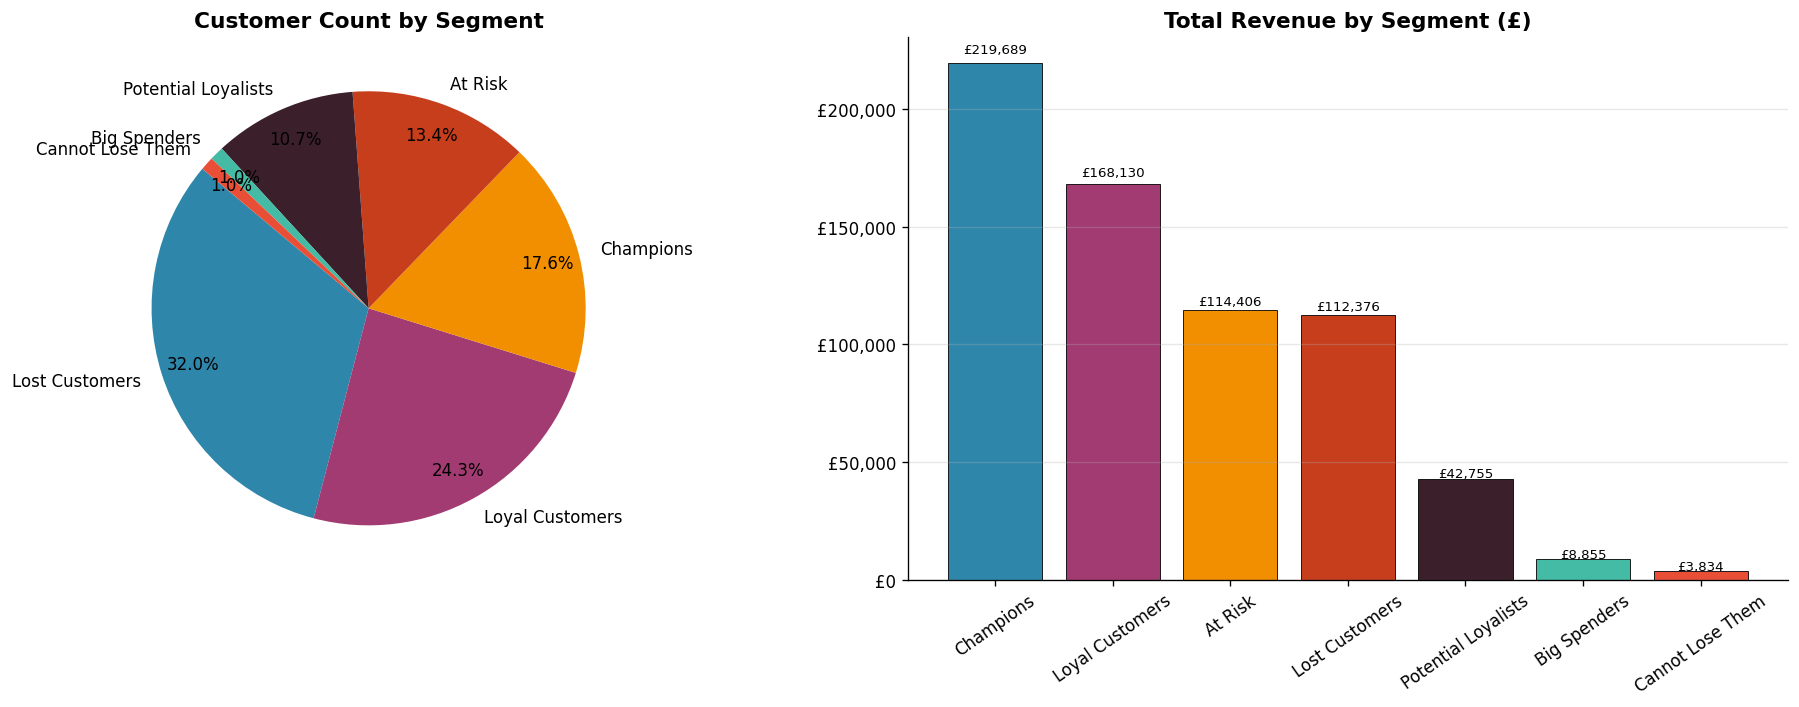
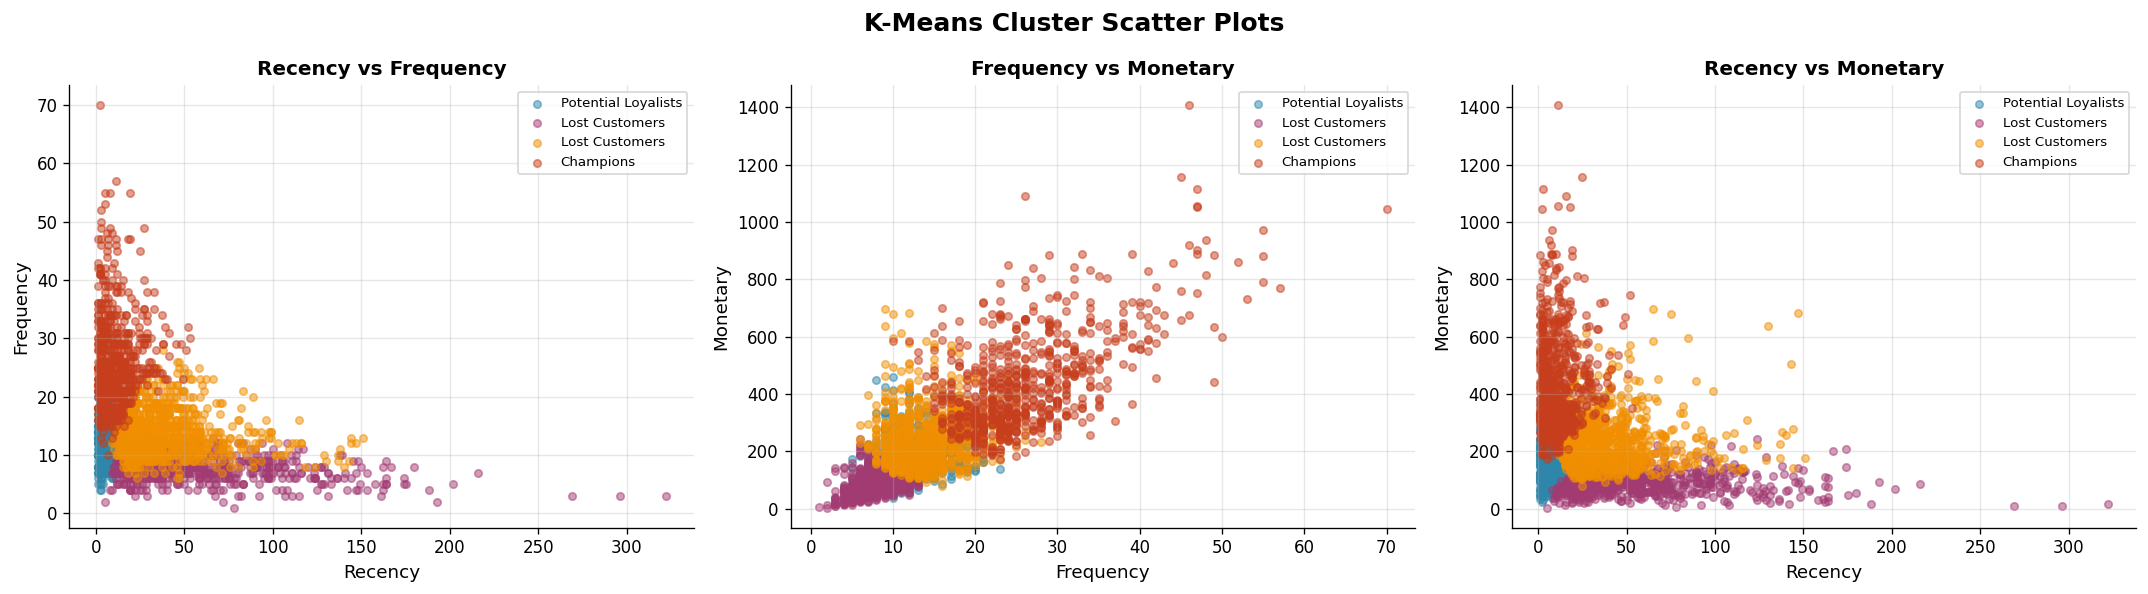
About 541K UCI Online Retail transactions: cleaning, RFM scoring, then K-Means, Hierarchical and DBSCAN benchmarked head to head, followed by PCA, CLV and cohort analysis in an interactive Streamlit app.
- K-Means (K=4) beat Hierarchical and DBSCAN on compact, explainable clusters, with a silhouette score of 0.52
- Champions are worth 8× the lifetime value of lost customers
- Cohorts lose 70%+ of customers by month 3, which is the window to act
- The "At Risk" and "Cannot Lose Them" segments hold £127K of recoverable revenue

QueryScratch · learn SQL by doing, live at queryscratch.com
SQL sql.js WebAssembly Supabase JavaScript
How it works, with a screenshot
A free SQL learning platform with 500 hand-written challenges. Queries run client-side on sql.js (WebAssembly) and are checked against the exact expected output.
- No server round trip and nothing to install: every query runs inside the browser
- Learn, playground, mock-interview and practice tracks, from beginner to expert
- Streaks and per-user progress on Supabase auth


What I check before I trust a number:
- The grain. Olist retention only makes sense on
customer_unique_id. Counted on the per-ordercustomer_id, repeat customers come out at 0%. - Artifact or signal. A dataset cut-off looks exactly like a downturn. I flag it before anyone reads it as one.
- Whether the data can prove it. When the placebo tests failed on the grocery campaigns, the finding became "the data can't show this worked", with a holdout design that would.
- Whether the model beats doing nothing. Prophet lost to a no-change baseline on fund NAVs, so it describes trends and forecasts nothing.
- Whether two tools agree. On the grocery report, reconciling DAX against SQL caught 3 DAX bugs before anyone saw them.
| Business intelligence | Power BI DAX Power Query Excel |
| Data engineering | SQL dbt PostgreSQL DuckDB Azure Data Factory Star schema ETL |
| Python and ML | Python Pandas NumPy scikit-learn statsmodels Prophet Streamlit |
| Cloud and ops | Microsoft Azure AWS Git GitHub Actions Jupyter |
| Credential | Issuer |
|---|---|
| PL-300 · Power BI Data Analyst Associate | Microsoft |
| AZ-900 · Azure Fundamentals | Microsoft |
| DP-900 · Azure Data Fundamentals | Microsoft |
| Cloud Practitioner | AWS |
| Investment Foundations | CFA Institute |
| SQL certificate | HackerRank |
Open to Data Analyst and BI Developer roles. sumitkprajapat29@gmail.com · LinkedIn · Portfolio
The graphics on this page are generated by scripts/build_assets.py, in a light and a dark version.